 Winter 2008 |
|
| PREVIOUS | PAGE 1 | |
Teaching and Evaluating Writing for the Biology Laboratory Bob Hodson |
|
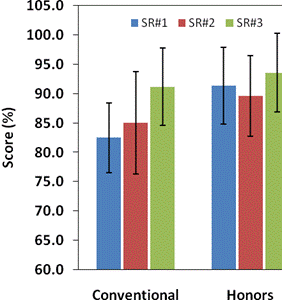
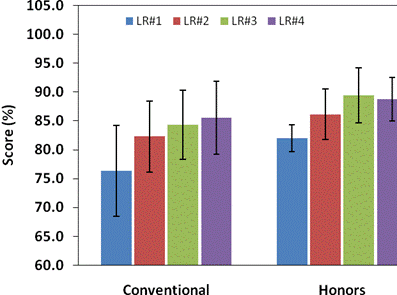
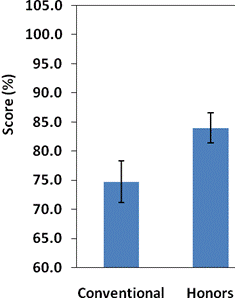
Teaching and Evaluating Writing for the Biology Laboratory Two perennial problems in biology education are teaching students critical thinking and writing skills and training laboratory assistants (TAs) how to evaluate student writing assignments. At the University of Delaware undergraduate students in our introductory biology lecture plus lab course are typically in their first year and have severely limited science writing experience. Our TAs are also usually in their first year of graduate studies and inexperienced in evaluating laboratory report writing. This situation can have a negative impact on communication in biology laboratory courses and research at both the undergraduate and graduate levels. We have been experimenting with various methods to remedy these problems. During the annual meeting at the University of Kentucky (2007), we reported on a project initially designed to test use of Calibrated Peer Review as a teaching tool (Mini workshop We had a subset of both students and TAs participating in CPR cycles. The expectation was that students would learn to think and write better, and TA grading with comments would be more consistent and helpful. We did receive some favorable comments from students but were unable statistically to assert that CPR was more useful to their learning than untrained peer review or just TA feedback. We were also unable to determine if TAs became more skilled and consistent evaluators because of their CPR experience. Some responsible factors were identified. One was the small number of participants (5 TAs and 49 students). A second was the difficulty graduate student TAs and students had in keeping up with deadlines imposed by the faculty-chosen CPR schedule. A third was student behavior – peer comments were not always offered, not always helpful, sometimes wrong, or not followed. A fourth was difficulty with, and resistance to, using the procedure we had to create for inserting figures and tables into html text. Lastly, we concluded it was a mistake not to award points for participation and quality. We should not leave an entirely negative perception, however. CPR could be useful in large enrollment courses where TAs are not available. Also at the Kentucky meeting we reported that a different method to try came out of training students for CPR project assessment. The method, called “norming”, has assessors read and evaluate sample student reports and discuss criteria until approximate agreement is reached. The method was tried in the sequel Spring Semester 2007 course. In the first week we held a norming session for TAs, only some of whom were assistants in a prior semester, and they subsequently repeated the process with their students. The results were promising. Average scores for conventional (non-honors) students were in the range of 70-85% from first to fourth report (an increase in average score of 15%) and for honors students in the range of 84-90% (an increase of 6%), thus both groups showed improvement over the four sequential reports. Variation between TAs was acceptable (standard deviation of 5-7%, n=24 lab sections of up to 18 students each). The variation on the final lab exam was about the same (SD = 6%) suggesting that difference in student ability between lab sections was a significant factor. We now have additional data coming from continuation of the norming method in the Fall Semester 2007 (Figs. 1-3) in which most TAs were new graduate students, and the results are very similar to the previous semester. Two types of reports were used. Short reports having only data presented as figures and tables and no text (Fig. 1) were alternated with long reports having Introduction, Results, and Discussion sections (Fig. 2). Average scores for both report types increased during the semester. Of particular interest is that average long report scores (Fig. 2) had ranges of 76-85% (conventional students; score increase of 9%) and 82-89% (honors students; score increase of 7%). Thus, for the second semester there was a trend of improvement in long reports for both groups. Report score variation represented by standard deviation was again about 6% whereas for the final lab exam it was 3-4% (Fig. 3). We conclude from two-semester’s experience with the norming method that we have a useful teaching and training approach for both TAs and students. In the Spring Semester 2008 we plan to add one more step. Before the first lab meeting, students will be assigned to write a long report with provided data. After a norming session with sample lab reports, TAs will evaluate the student work and provide feedback. Grades will not be counted, and instead students will be awarded participation points. *Robert Hodson, Linda Dion, and Dee Baer are at the University of Delaware; Todd Nickle is at Mount Royal College, Calgary, Alberta.
Figure 2. Average long report scores with standard deviations for conventional and honors students in a first semester introductory biology course. A long report rubric was used (available upon request). N = 35 sections for conventional students; N = 5 sections for honors students.
Figure 3. Average final lab exam scores with standard deviations for conventional and honors students in a first semester introductory biology course. N = 35 sections for conventional students; N = 5 sections for honors students. |
|
| PREVIOUS | PAGE 1 | |


 Figure 1. Average short report scores with standard deviations for conventional and honors students in a first semester introductory biology course. A short report rubric was used (available upon request). N = 35 sections for conventional students; N = 5 sections for honors students.